Health Timelines
Understand what changed in your body, and when.
A widget holds one metric inside one space of time. Open it and the same metric runs across the years.
One purchase · no subscription · iPhone, iPad and Mac
Scroll to open the widget
A timeline
Pick a metric. Pick a space of time. Read the lane.
The timeline keeps the recipe; the samples are read from Health every time.
- 01
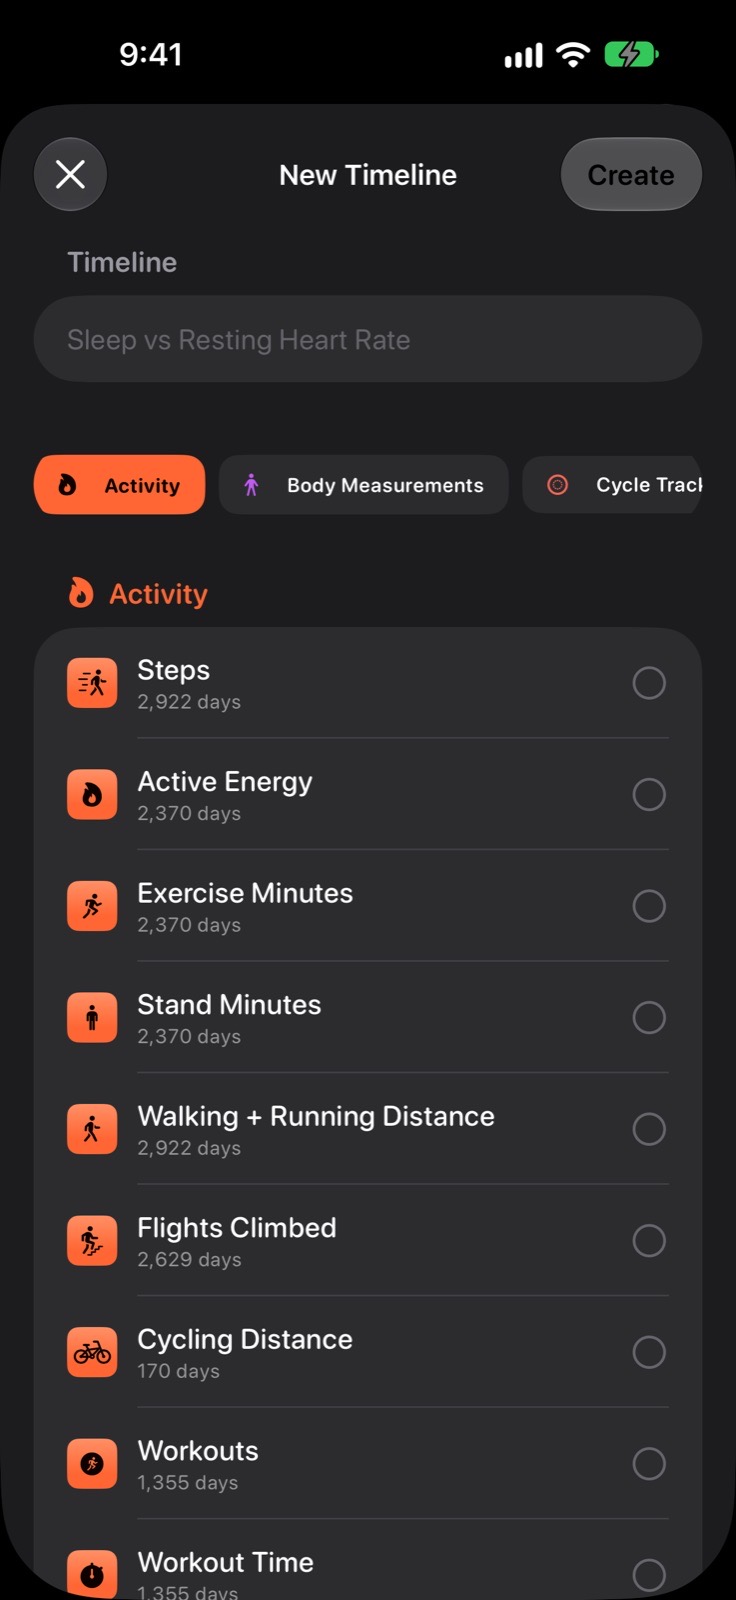
The metric
Forty-six of them, in fourteen categories, with the colour Health gives each one.
- 02
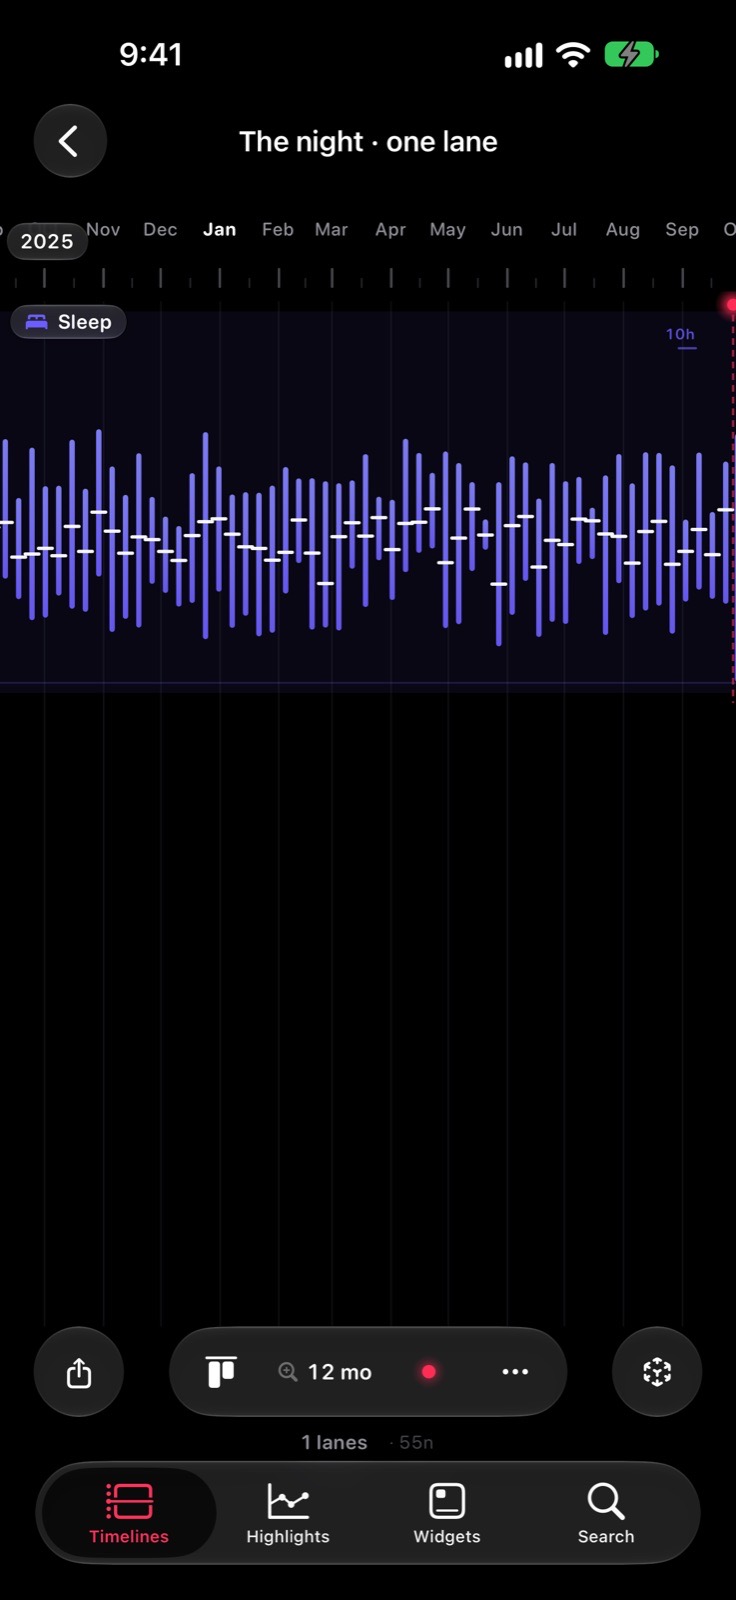
The space
Eight of them. The night is named by its own hours; an open space ends at Now.
- 03
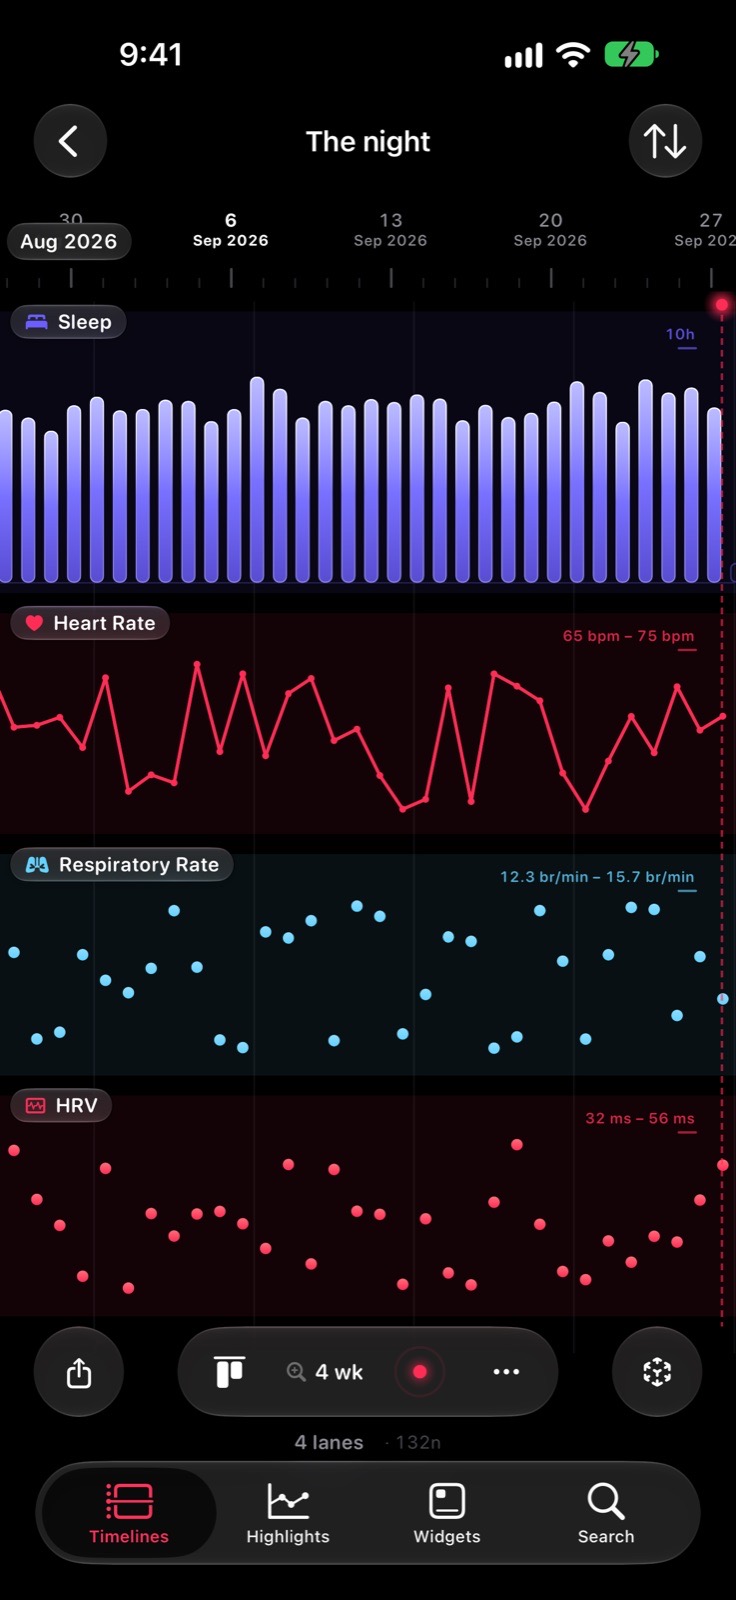
The lane
One lane per metric, on one proportional axis. No second scale, ever.
- 04
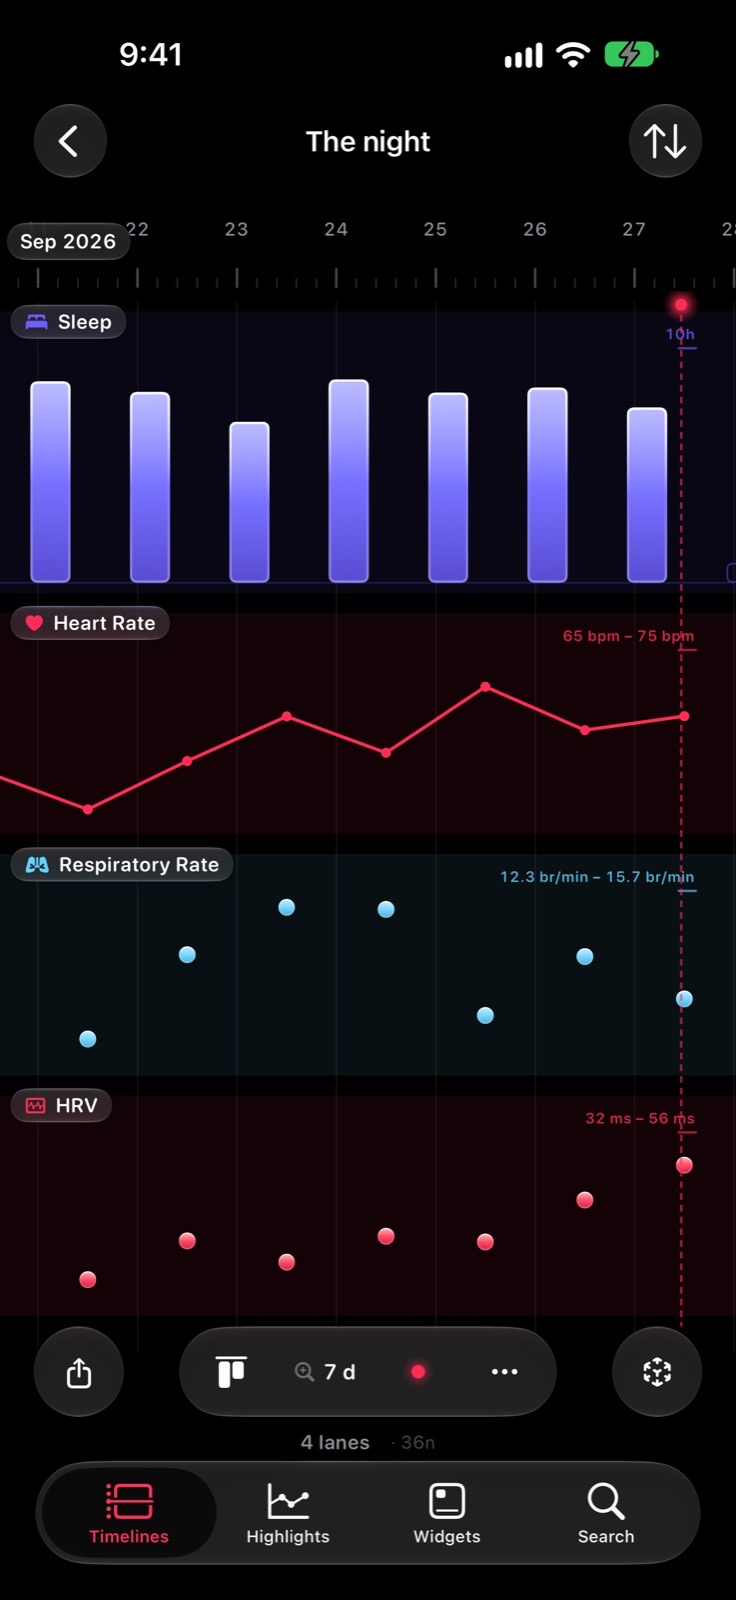
Zoom
From eight years to a single evening, and the marks change with it.
Eight spaces of time
A day has more than one shape.
Each space is a real stretch of your day, not a bucket.
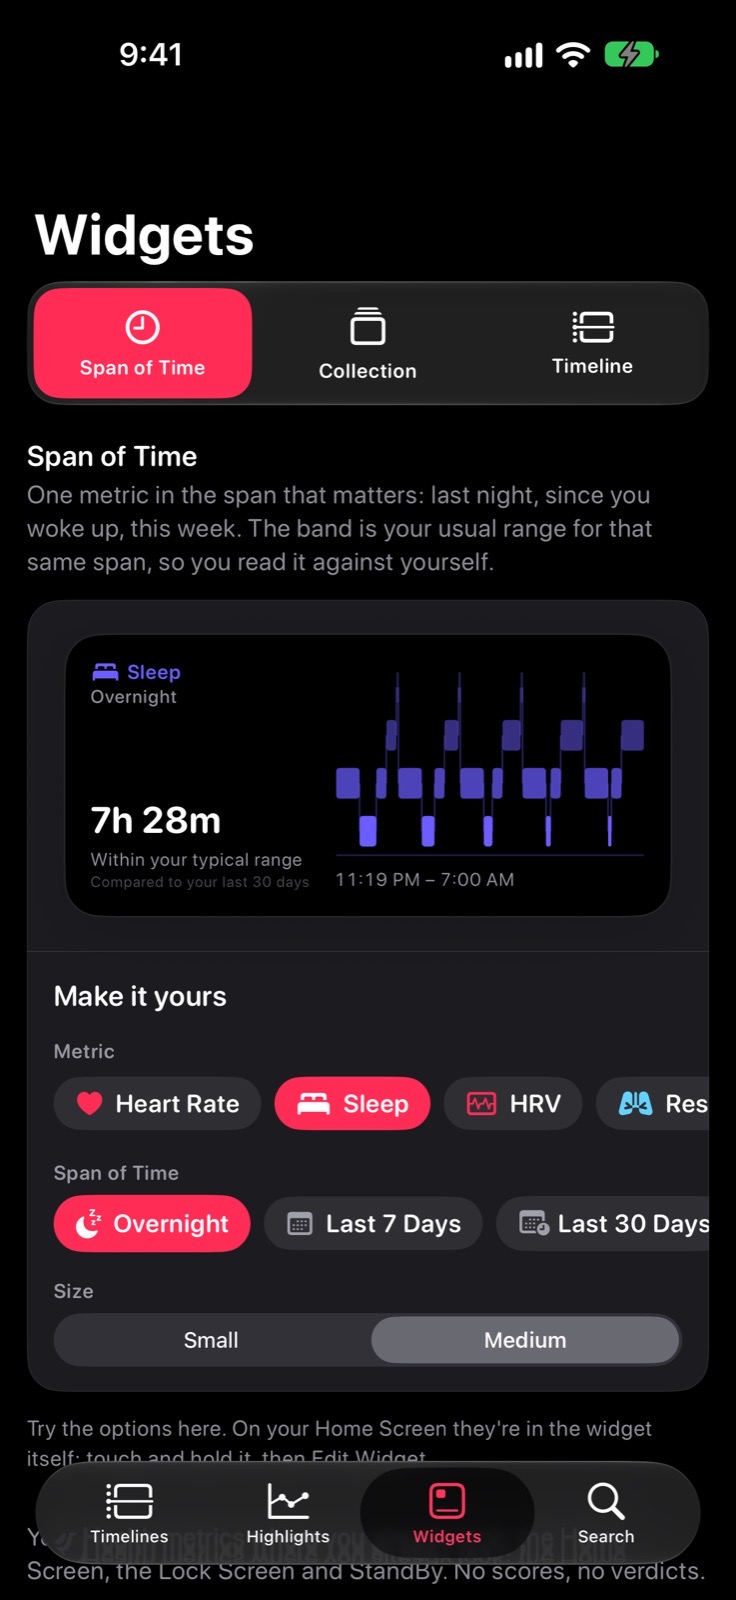
- OvernightFrom when you lay down to when you got up. 22:55 – 6:11.
- Since you woke upAn open space. It ends at Now.
- TodayMidnight to now.
- MorningThe first part of the day.
- AfternoonThe middle.
- EveningUntil you lie down again.
- Last 7 daysA week, day by day.
- Last 30 daysA month, with the gaps visible.
Hours are shown in your own time format. A space with no reading says so; it does not fill in.
Nine views
- Today
- Night
- History
- Heart & Pressure
- Sleep & Breathing
- Mind
- Light & Rhythm
- Mobility
- Night Owl
Three to start with, six more when a question needs them. There is also a calendar, where a day is a mosaic of the metrics that had a reading, and a grid of a year per page.
Your typical range
The only comparison is with you.
The middle half of your last thirty complete days, drawn as a band behind the lane.
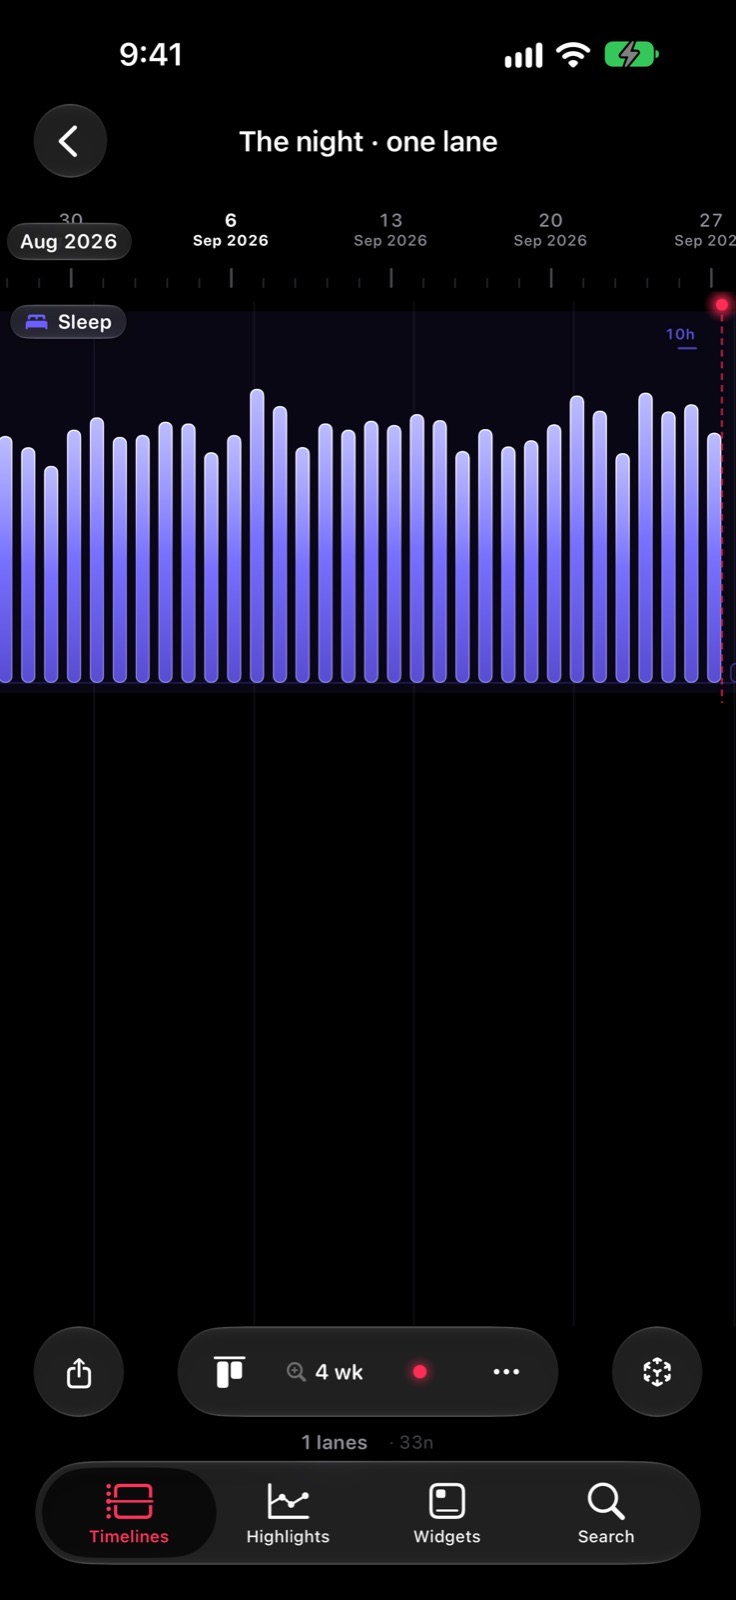
- Within your typical rangeThe reading sits inside the band.
- Above your typical rangeHigher than usual for you. Not high.
- Below your typical rangeLower than usual for you. Not low.
- Not enough daysUnder seven complete days there is no range, and the widget says so.
- Less for you · More for youIn the grid, against your own thirds. A point metric only marks the day with a reading.
No score, no verdict, no traffic light. No population threshold, no percentile, and nothing that reads as a diagnosis.
Widgets
The widget is the door.
One metric, one space of time, on the Home Screen.
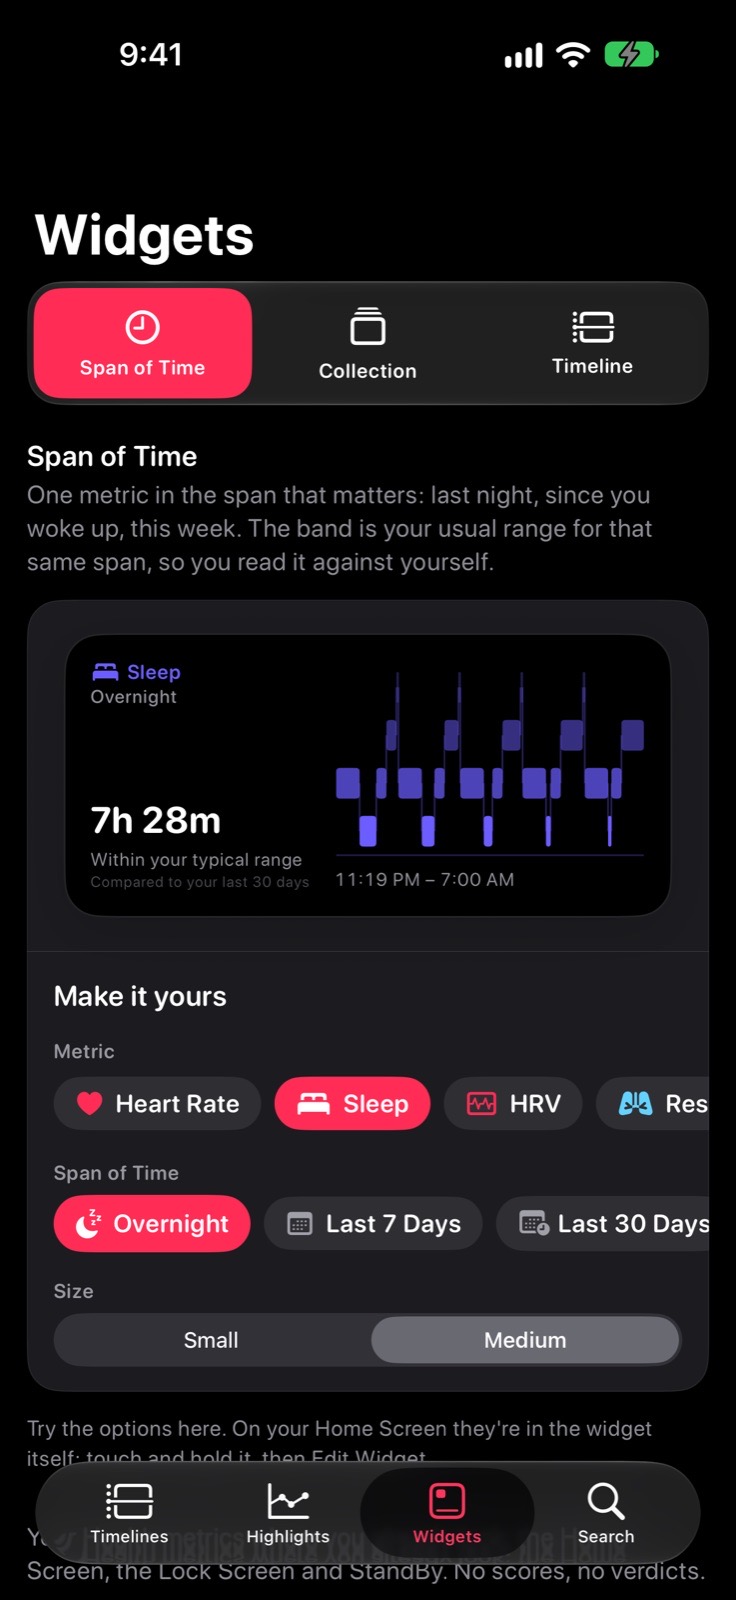
Span of TimeOne metric inside one space, from the Lock Screen up. 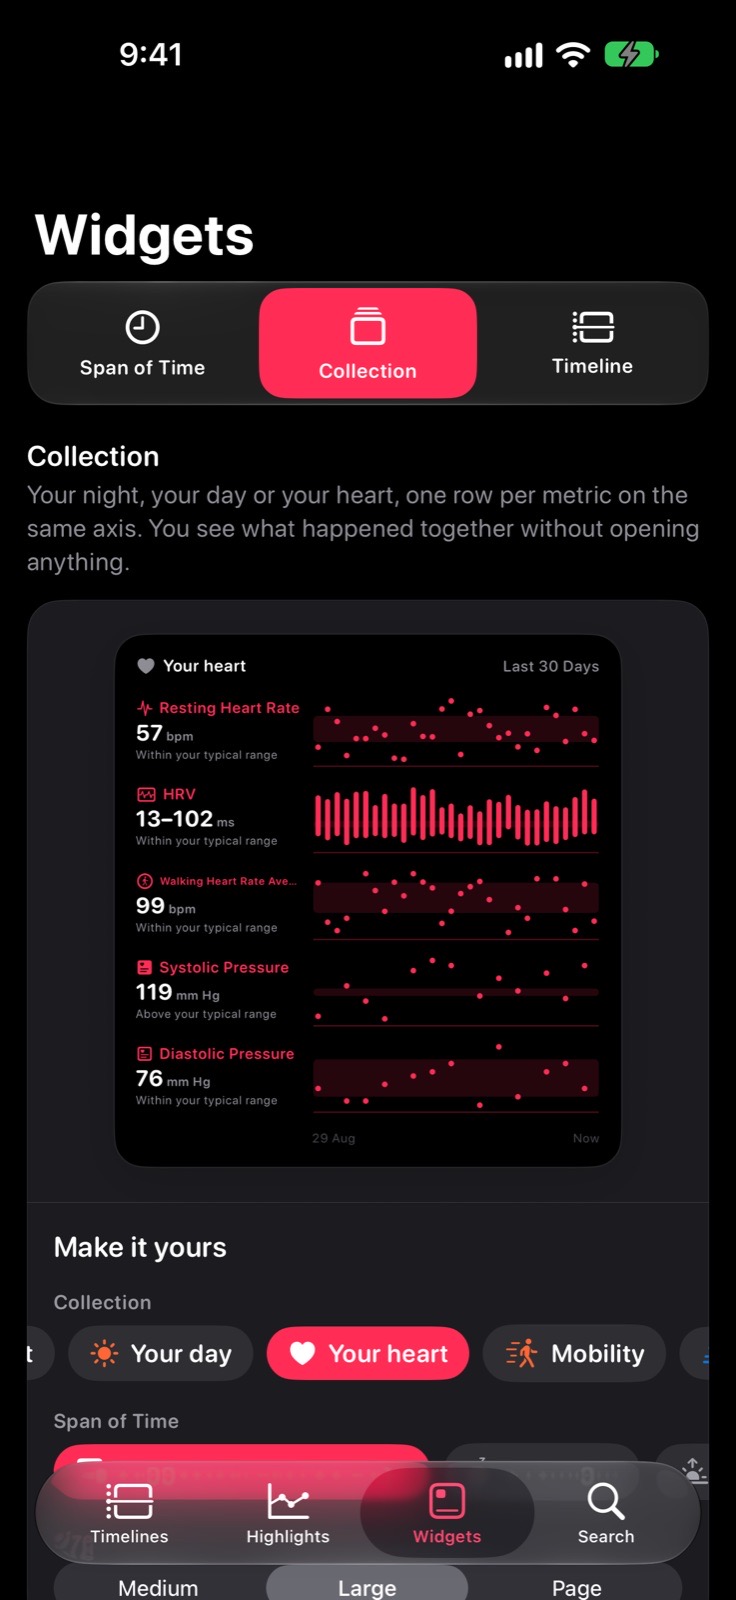
CollectionUp to six metrics that belong together. 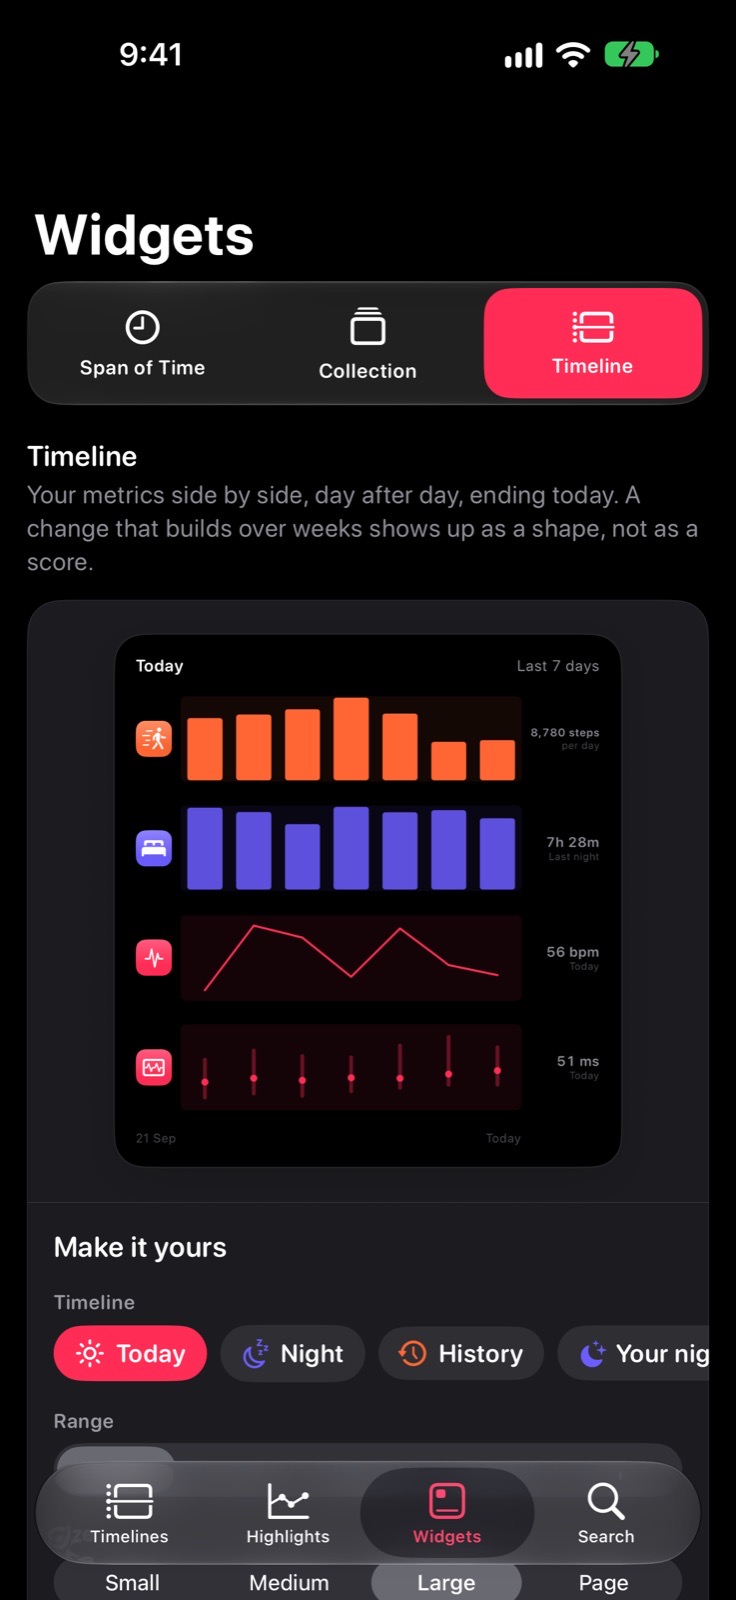
TimelineYour lanes side by side, ending now.
Beyond the iPhone
iPhone, iPad and Mac.
The same timelines, with the room each screen has.
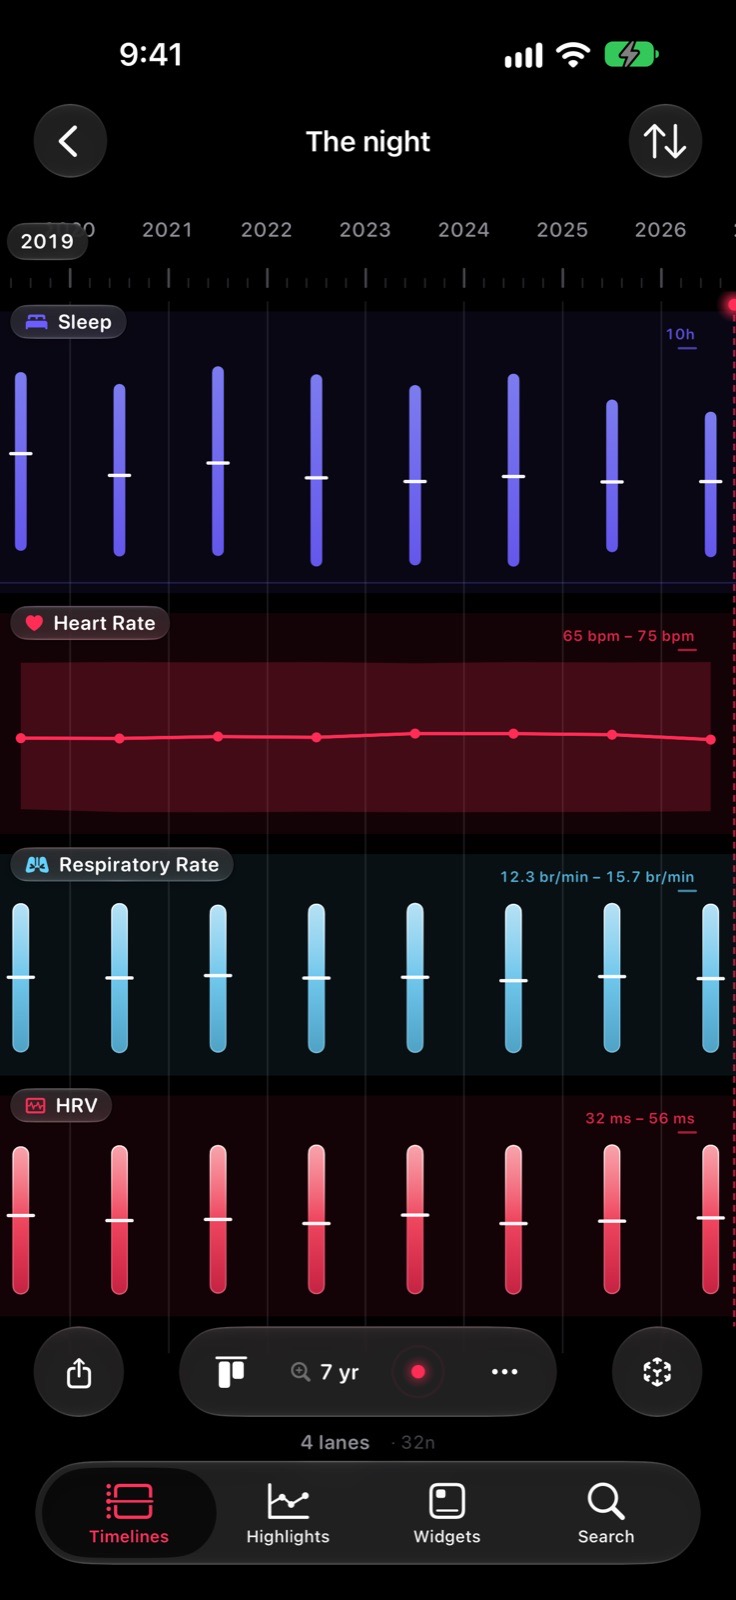
iPhone
Four tabsTimelines, Highlights, Widgets and Browse.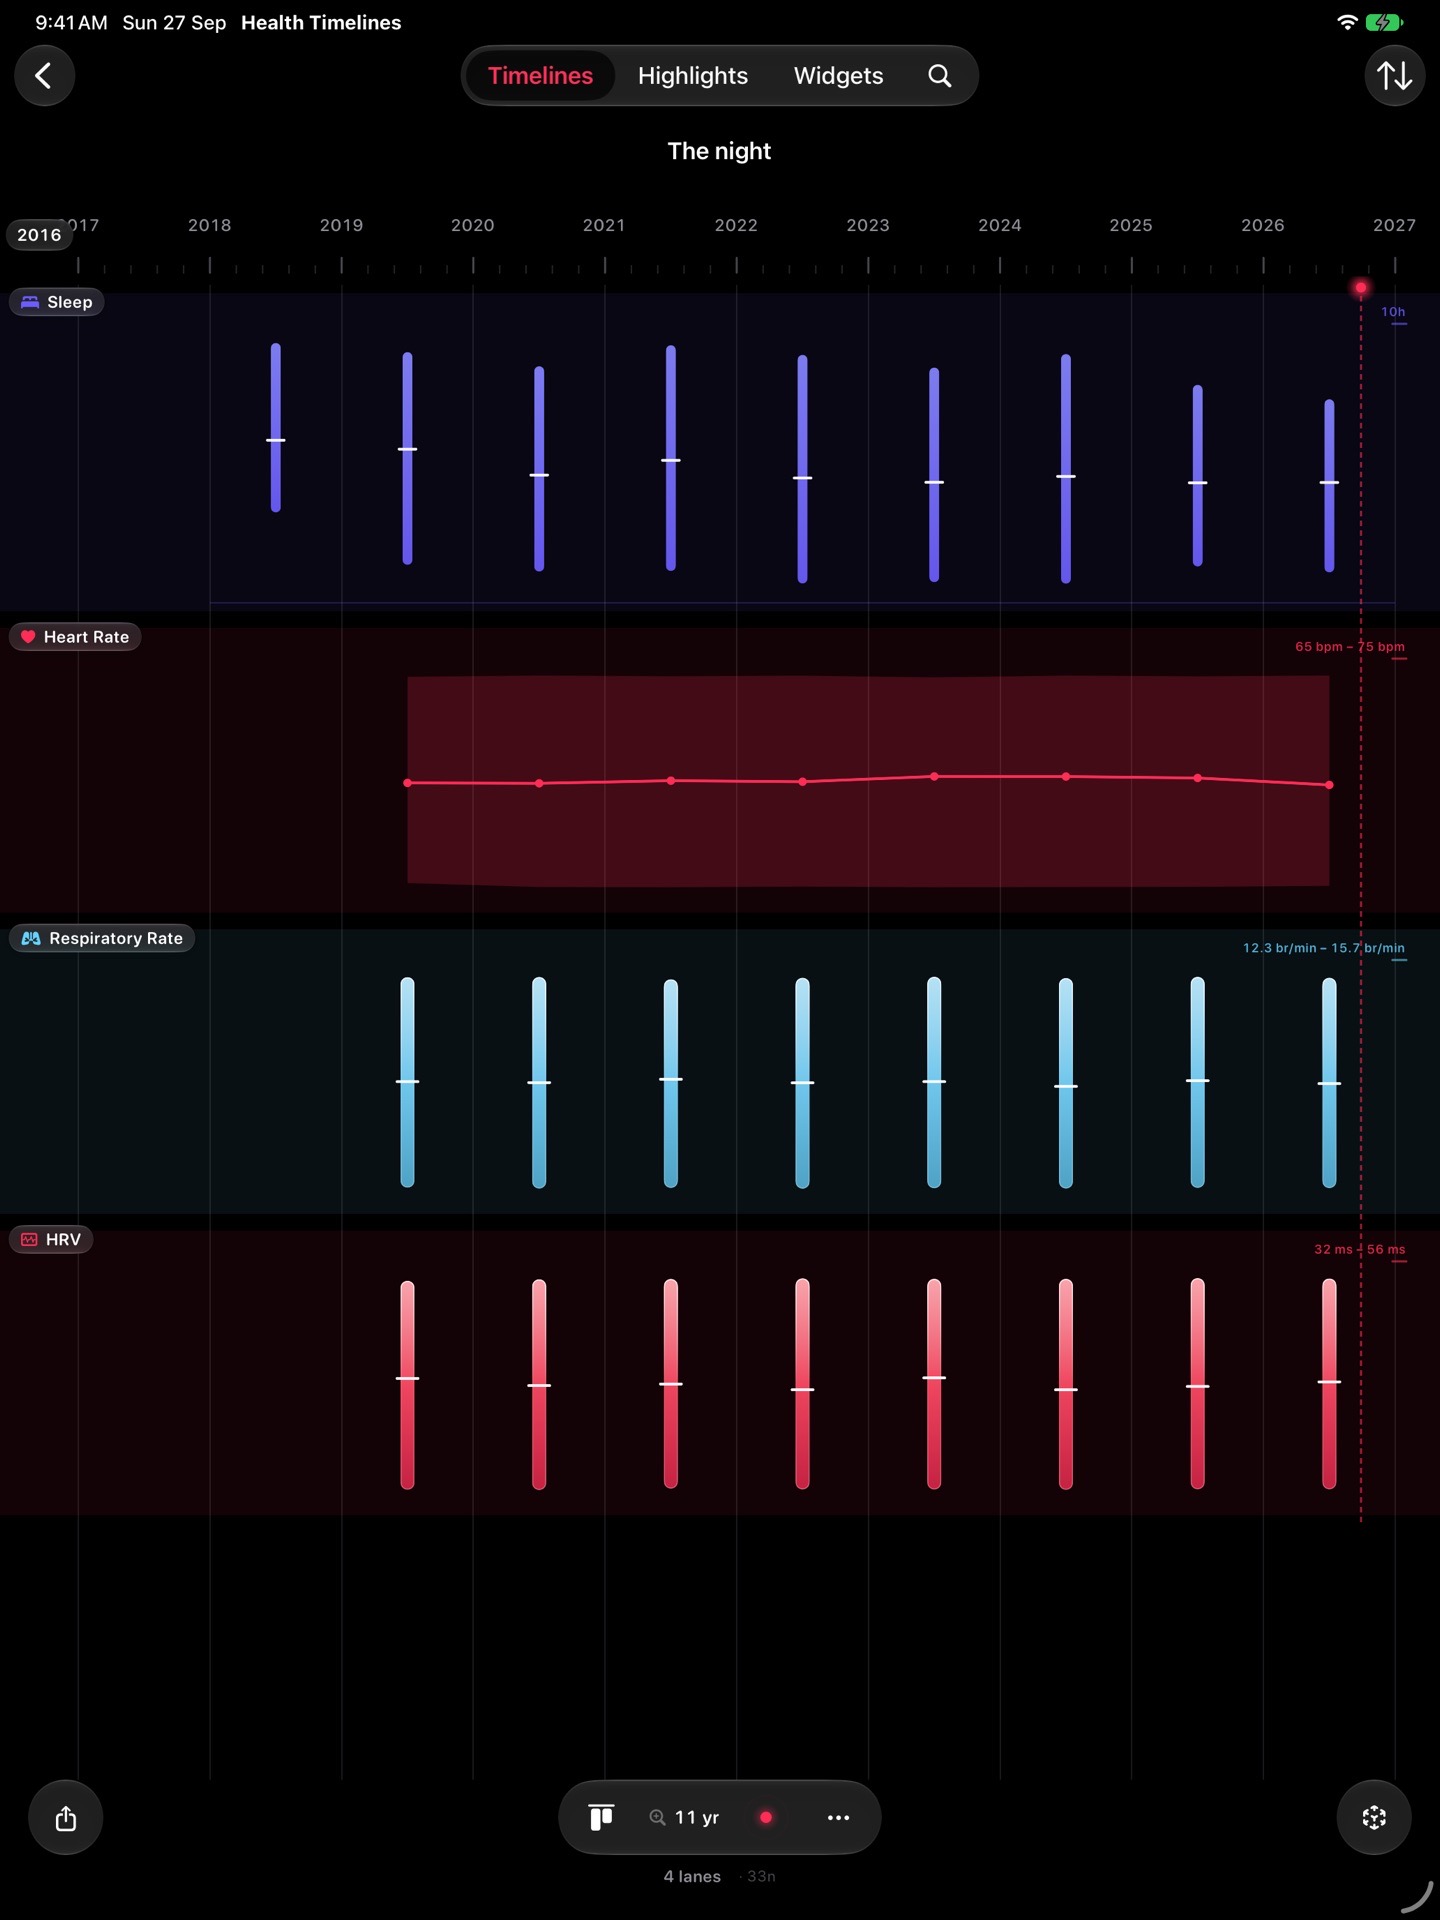
iPad
More roomMore lanes on screen, and the keyboard to move through the years.Mac
The whole historyThe Mac reads the mirror, so the years are there without Health.Your data moves only between your devices and your private iCloud, encrypted. Nothing reaches the developer.
App Store
One purchase.
No subscription.
On the App StoreComing soon
iPhone · iPad · Mac
- 46 metrics, 14 categories
- Eight spaces of time
- Nine views
- Your own typical range
- Three widgets
- Export as PDF, CSV or video